Tide Dry Cleaners Price List: POS-Ready Guide for Owners
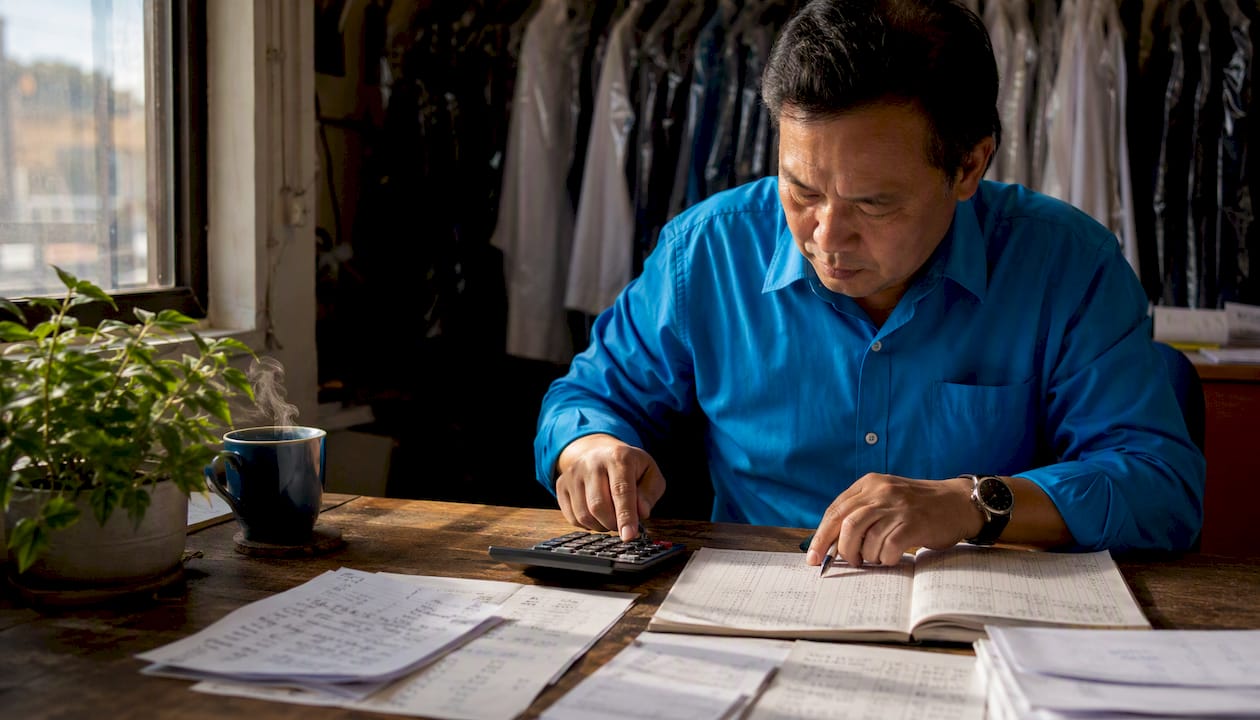
There is no single national Tide dry cleaners price list you can download and copy into your POS. Tide Cleaners franchise locations carry royalties and marketing fees that independent operators do not pay that independent operators simply don’t pay — so their retail prices reflect a cost structure you don’t share. The right move: build your own cost-based price list, add convenience and rush modifiers, and load it into your POS today.
Your immediate next steps:
- Run a per-item cost calculation for your top SKUs (dress shirt, wool suit, dress, coat)
- Add convenience modifiers: rush fees, pickup/delivery premiums, stain removal
- Upload the finalized list to your POS with modifier groups attached
- Schedule an 8–12 week test before locking in permanent prices
Table of Contents
- Why copying a chain’s price list will hurt your margins
- What goes into every dry-cleaning price?
- Illustrative U.S. price ranges and a sample operator price list
- Pricing strategies that protect margins and build pricing power
- How to map your price list into your POS
- How to test prices and measure what’s working
- Your pricing checklist and template
- Key Takeaways
- Pricing discipline is an operational problem, not a math problem
- Kansoflow puts your price list to work from day one
- Useful sources and further reading
Why copying a chain’s price list will hurt your margins
Tide Cleaners franchise initial investments range from roughly $160,000 for a drop store to $1.5 million for a full plant store. That capital structure, combined with ongoing royalties and national ad fund contributions, forces franchisees to price differently than you do. Their menu prices absorb costs you’ve never seen on your P&L.
Beyond the franchise math, five local variables make any copied price list unreliable:
- Labor mix: Your wage rates and staffing ratios are unique to your market and hours
- Lease and utilities: A 1,200 sq ft shop in suburban Ohio costs nothing like one in downtown Chicago
- Solvent and chemical choice: Hydrocarbon, GreenEarth, and wet-cleaning each carry different per-load costs
- Equipment capacity and utilization: Low throughput spreads fixed overhead across fewer garments, shrinking margin per unit
- Service mix: A shop doing 25% pickup/delivery has a different cost profile than one that’s 100% walk-in
Pro Tip: Treat any competitor’s public price as a market signal, not a cost basis. Use it to test price elasticity — if you’re $2 below them on dress shirts and still losing customers, the problem isn’t price.
What goes into every dry-cleaning price?
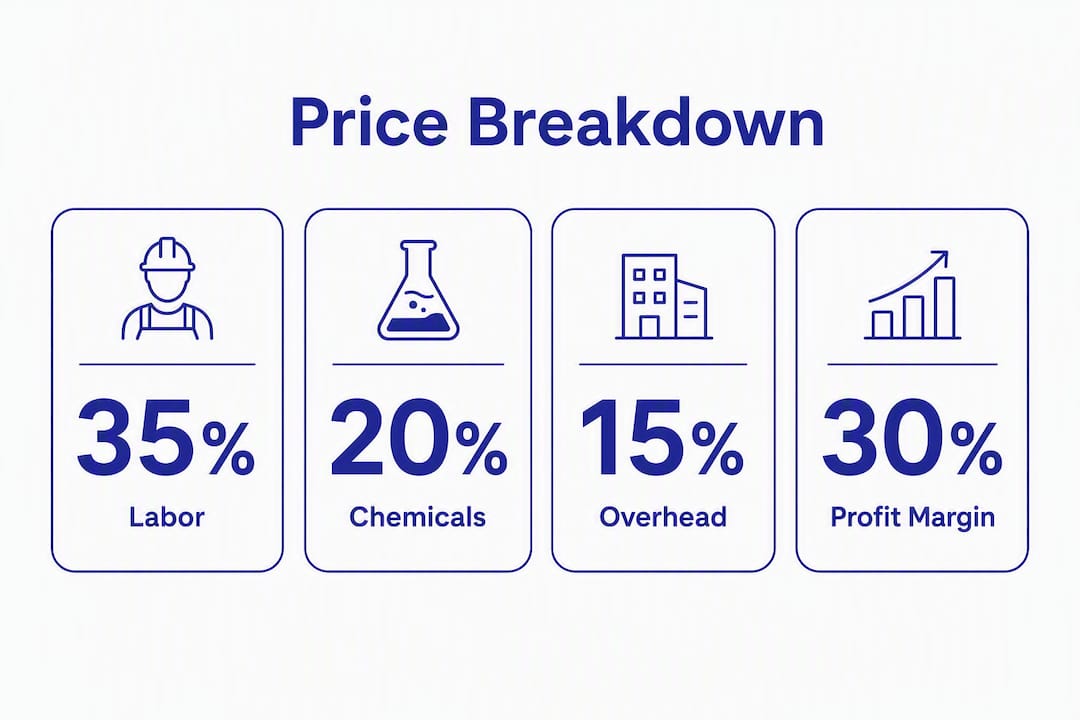
Most U.S. dry cleaners generate $250,000–$759,000 in annual revenue with profit margins of 5%–15%, and labor alone runs 30%–40% of revenue. That range tells you exactly how tight the math gets when you skip the cost model.
Every per-item price needs to cover these components:
| Cost Component | Typical % of Revenue |
|---|---|
| Direct labor (per garment) | 30%–40% |
| Solvent, chemicals, utilities | 10%–15% |
| Packaging, tags, consumables | 3%–5% |
| Equipment depreciation/lease | 5%–8% |
| Rent and overhead allocation | 10%–15% |
| Re-clean allowance | 2%–4% |
The margin formula:
A worked example: if your all-in cost for a dress shirt is $3.50 and you target a 55% gross margin, your floor price is $3.50 ÷ 0.45 = $7.78. Add a $2.00 rush modifier and your rush price is $9.78. That’s the math — not what Tide charges down the street.
Re-clean rates are a hidden margin killer. Include a re-clean allowance in every base price to cover costs from re-cleaning, or you’re subsidizing mistakes out of profit.
Illustrative U.S. price ranges and a sample operator price list
These ranges reflect typical U.S. independent operator pricing. They are illustrative starting points, not a substitute for your own cost model.
| SKU | Typical U.S. Range | Example Operator Price (cost-derived) |
|---|---|---|
| Rush fee (same/next day) | —–$12.00 | — |
| Pickup/delivery fee | —–$15.00 | — |
All prices illustrative. Adjust based on your per-item cost model and local market.
Per-item vs. per-kg pricing is a real choice. Per-item works best when your garment mix is varied and your POS can track SKUs individually. Per-kg makes sense for high-volume wash-and-fold or linen contracts where weighing at intake is faster than itemizing.
Pricing strategies that protect margins and build pricing power
Competing on price alone is a race to the bottom. Shifting to service-heavy offerings — commercial linen contracts, specialty garment care — creates pricing power and more stable margins.
Strategies worth deploying:
- Commercial linen contracts: Set minimum volumes, monthly invoicing, and annual escalators (CPI + 2% is a common structure)
- Specialty care: Leather, suede, and wedding gown preservation command 2x–3x standard rates
- Shirt bundles: 5-shirt or 10-shirt bundles at a slight discount increase ticket size and lock in repeat visits
- Subscriptions: Monthly plans (e.g., 8 shirts/month) reduce churn and smooth revenue
- Tiered rush fees: Same-day at a premium, next-day at a lower premium — gives customers a choice and you a margin buffer
- Delivery minimums: A $25–$35 order minimum for pickup/delivery protects route economics
Pickup and delivery often grows to 15%–25% of shop volume. Price it to cover direct cost plus a reliability premium — customers paying for convenience are less price-sensitive than walk-ins.
Pro Tip: Pilot rush fees and a subscription tier together for 8–12 weeks. Measure average ticket and subscription retention separately. You’ll know within 10 weeks whether either strategy is worth keeping.
How to map your price list into your POS
Map each SKU to a discrete POS item, attach modifier groups (rush, fabric care, stain removal, delivery), and create bundle and subscription SKUs as separate line items. That structure gives you clean reporting, accurate discounting, and a re-clean rate you can actually track.
Implementation checklist for your first POS session:
- Create individual SKUs for every garment type (shirt, suit, dress, coat, specialty)
- Assign cost-center or GL codes to each SKU for margin reporting
- Build modifier groups: Rush (same-day, next-day), Fabric Care (premium, delicate), Stain Removal, Delivery Fee
- Set delivery fees as service SKUs, not discounts, so they appear on receipts and reports
- Create bundle SKUs (5-shirt, 10-shirt) with the discounted price baked in
- Enable automated SMS notifications for “Ready for Pickup” and unclaimed-order reminders
- Run a pilot day with staff before going live
Kansoflow’s Visual Kanban board maps directly to this workflow: orders move through Wash, Fold, Dry Cleaning, and Ready stages visually, so attendants always know where a garment is. Photo intake at the counter eliminates lost-item disputes before they start. For shops running drop-off locations that send work to a central plant, inter-branch transfer tracking keeps garments from falling through the cracks. Bluetooth scale integration handles per-weight pricing without manual entry, and per-item reporting lets you pull re-clean rates by SKU — which is exactly the data you need for the next price update.
How to test prices and measure what’s working
Run a time-boxed test on a controlled SKU set, measure KPIs, then iterate. Eight to twelve weeks gives you enough data to see real patterns without locking in a bad price for a full season.
| Phase | Timing | Action |
|---|---|---|
| Setup | Week 0 | Finalize SKUs, modifiers, and baseline cost model in POS |
| Baseline | Weeks 1–2 | Record average ticket, re-clean rate, delivery penetration |
| Active test | Weeks 3–10 | Run new prices; track KPIs weekly |
| Analysis | within 8–12 weeks | Compare KPIs to baseline; decide what stays |
KPIs to track:
- Average ticket value
- Subscription conversion and 30-day retention
- Re-clean rate by SKU
- Machine utilization (processed garments vs. theoretical capacity)
- Delivery penetration as a percentage of total volume
- Gross margin per SKU
When you raise prices, tell customers why. A simple message works: “Starting [date], our prices will reflect updated cleaning costs and the quality of care your garments deserve. Thank you for trusting us.” Two sentences. No apology.
Your pricing checklist and template
Use this checklist before you go live with any new price list:
- Run the per-item cost model for every SKU you sell
- Set a target gross margin (most independent operators target 50%–60% gross)
- Create all SKUs and modifier groups in your POS
- Set commercial tier pricing and minimum volumes for linen/B2B accounts
- Configure automated SMS notifications for ready-for-pickup and unclaimed orders
- Schedule your 8–12 week test window before finalizing prices
- Test receipt output: verify modifier labels print correctly and tax handling is accurate
- Confirm mobile receipt language matches in-store signage
- Run a staff training session on the Kanban stages and modifier entry before launch
For the downloadable CSV template, structure your columns as: SKU | Description | Base Price | Cost | Margin Target | Modifier IDs. Import that file directly into your POS to skip manual entry. Kansoflow supports CSV-based item imports, so you can go from spreadsheet to live menu in one session.
Key Takeaways
There is no national Tide dry cleaners price list that works for independent operators — build a cost-based list, load it into your POS, and test it for 8–12 weeks before treating any price as permanent.
| Point | Details |
|---|---|
| No universal price list exists | Tide franchise costs include royalties and fees that don’t apply to independent shops. |
| Cost model first | Use the margin formula: price = direct cost ÷ (1 − target margin), then add modifiers. |
| Build in re-clean costs | Include a re-clean allowance of 2%–4% of revenue in every base price to prevent margin erosion. |
| Test for 8–12 weeks | Track average ticket, re-clean rate, and delivery penetration before locking in prices. |
| Use Kansoflow to implement | Map SKUs, modifiers, and Kanban stages in Kansoflow to track pricing performance by item. |
Pricing discipline is an operational problem, not a math problem
Many operators recognize their prices may be set too low but hesitate to raise them without adequate data. What stops them isn’t the math — it’s the fear of losing customers and the absence of data to prove the new price is working.
That’s the real gap. When you can’t pull a re-clean rate by SKU, or see machine utilization against theoretical capacity, you’re setting prices by instinct. And instinct tends to undercharge, especially on specialty services where customers expect to pay more anyway.
The operators who get pricing right aren’t the ones with the best spreadsheet. They’re the ones who close the loop between what they charge, what it costs, and what the POS reports back. Undercalculating re-cleans and ignoring machine utilization are the two most common ways operators quietly bleed margin for years without realizing it. A POS that surfaces both of those numbers, by item, by week, changes how fast you can act on a bad price.
Kansoflow puts your price list to work from day one
Running a dry-cleaning or laundromat operation means your price list has to live inside your workflow, not just on a laminated sheet at the counter. Kansoflow gives you a flat monthly subscription per location, with no per-seat fees for your team, so the cost of adding staff to the system never grows with your headcount.

Import your CSV price template, map SKUs and modifier groups, and your staff sees every order move through the Visual Kanban stages in real time. Photo intake at the counter documents garment condition before cleaning, cutting dispute time to near zero. Star Micronics receipt and tag printers connect natively, Stripe and Square handle payments, and per-item reporting shows you re-clean rates and margin by SKU after every test cycle. SMS notifications go out automatically when orders are ready, and again if they go unclaimed.
Start with the features overview to see how SKU mapping, modifier groups, and Kanban stages work together, then book a demo to walk through importing your first price list.
Useful sources and further reading
- BusinessDojo: Dry cleaner average revenue, profit and margins — U.S. revenue benchmarks ($250,000–$759,000), margin ranges, and labor cost percentages
- BusinessDojo: How to price dry cleaning services — per-item vs. per-kg pricing, pickup/delivery volume benchmarks, and add-on strategies
- LegalClarity: Are dry cleaners profitable? — single-location revenue benchmarks and the case for service-heavy pricing
- Beancount.io: Dry cleaning bookkeeping and per-garment costing — re-clean tracking, machine utilization, and unclaimed inventory management
- Tide Franchise: Franchise costs and fees — royalty and marketing fee structure for context on why chain prices don’t translate to independent shops
- 1851 Franchise: Tide Cleaners franchise costs — investment ranges by store type (drop store vs. plant store)
- State bailee-lien statutes: Search your state attorney general’s website or consult a local attorney for holding-time rules and unclaimed property obligations specific to your jurisdiction. Rules vary significantly by state and affect how long you can hold unclaimed garments before disposal or sale.
This article is general operational and pricing information, not legal, tax, or financial advice. Confirm current regulations and cost figures with a qualified professional for your specific situation.